U.S. TEXTILES BY THE NUMBERS
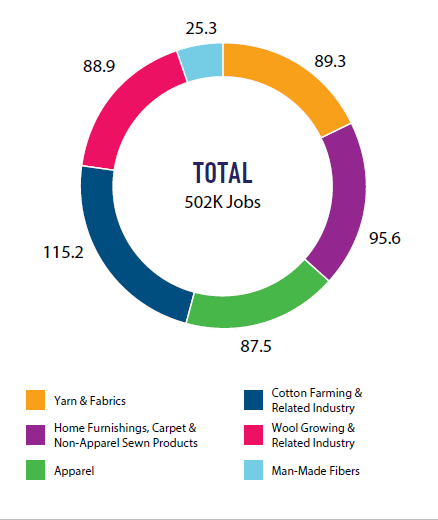
2023 EMPLOYMENT 2
2023 Textile Supply Chain Jobs in Thousands
TOP 5 STATES FOR
TEXTILE JOBS IN 2023 4
- 1. Georgia …………………………… 43,129
- 2. North Carolina …………………….. 30,607
- 3. South Carolina …………………….. 18,364
- 4. California …………………………. 12,840
- 5. Virginia …………………………… 9,615
Figures exclude apparel manufacturing and cotton & wool farming jobs
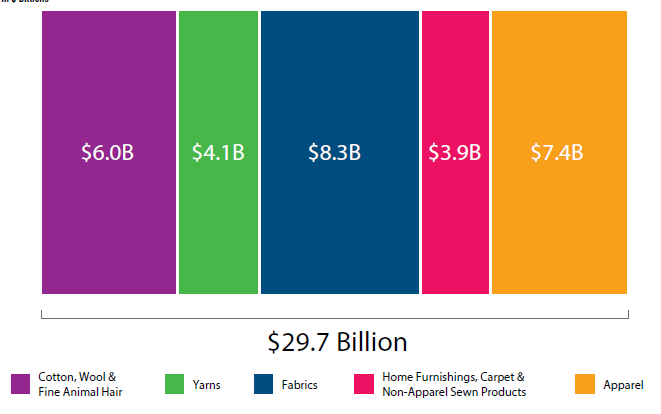
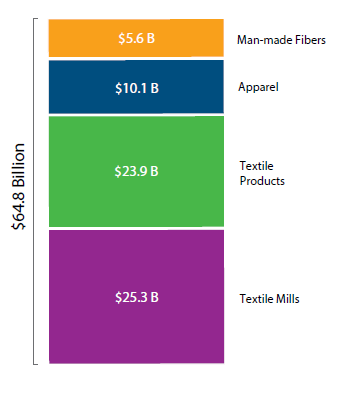
VALUE OF SHIPMENTS 1
2023 Value of Shipments for Man-Made Fibers, Yarns,
Fabrics, Apparel & Sewn Products in $ Billions
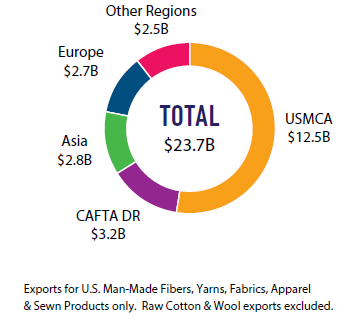
EXPORTS OF ALL FIBERS, YARNS, FABRICS APPAREL & SEWN PRODUCTS 5
The United States is the 2nd largest global exporter of textile-related products.
2023 EXPORT BREAKDOWN
BY REGION 6
In $ Billions
TOP 5 EXPORT MARKETS BY COUNTRY FOR U.S. YARNS & FABRICS7
In $ Billions & $ Millions
- 1. Mexico ………………………. $3.7B
- 2. China ………….……..………. $2.0B
- 3. Canada ………..………..……. $1.9B
- 4. Honduras ……………….…… $1.2B
- 5. Vietnam ………..…………….. $0.9B
Figures exclude Natural fiber, apparel & sewn products
The above totals include cotton fiber exports of $1.6B to China and $0.9B Vietnam
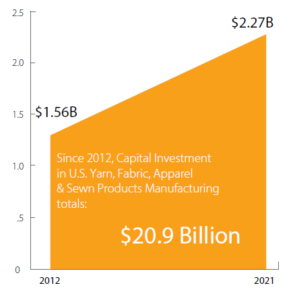
CAPITAL INVESTMENT 3
Capital Investment in U.S. Yarn, Fabric, Apparel
& Sewn Product Manufacturing – Data in $ Billions
SOURCES
- U.S. Census Bureau, Manufacturers’ Shipments, Inventories, and Orders (M3) Survey, and Annual Survey of Manufacturers (ASM), value of shipments for NAICS 313, 314, 315 & 32522. 2020 data used to estimate 2021 NAICS 32522 figure.
- Bureau of Labor Statistics, National Cotton Council & American Sheep Industry Association.
- U.S. Census Bureau, Annual Capital Expenditures Survey (ACES), NAICS 313, 314 & 315.
- Bureau of Labor Statistics, Quarterly Census on Employment and Wages (QCEW), June 2022 NAICS 313, 314 & 32522.
- U.S. Department of Commerce and U.S. International Trade Commission.
- U.S. Department of Commerce data for Export Group 0: Textiles and Apparel.
- U.S. International Trade Commission, data for HTS chapters 50-60.

